“The Maya abandoned what had been densely populated urban centers”
~ Climate and the Collapse of Maya Civilization, Peterson & Haug
“The city of Rome underwent depopulation during the 5th century […] By the 6th century the population of Rome had fallen to a mere 80,000.”
“Civilization, according to the Romans, was based on the city. Only barbarians lived in non-urban societies.”
~ “The Fall and Decline of the Roman Urban Mind“, Svante Fischer, Hans Lejdegård and Helena Victor
Historically, societal retrogression and civilizational collapse have been associated primarily with one thing: demographic shrinkage of urban cores.
Part One: Demographic Growth in Tokyo
Tokyo’s population increased continuously since the end of WWII, with the exception of the periods 1975-1980 (minus 5,000) and 1990-1995 (minus 9,000). Both number represent less than one tenth of one percent of Tokyo’s population.
Overall growth from 1990 to 2015 exceeded 1.5 million, representing greater than 10% growth spread across a 25 year period.

Sources: Statistics Division, Bureau of General Affairs, TMG; “Population of Tokyo (estimates)” Ministry of Internal Affairs and Communications; “Population Census” [as cited on metro.tokyo.jp]
Many of Japan’s most iconic urban real-estate developments were built in the 90’s:
- Shiodome (planning: ~1984-1995, construction: ~1995-2002). 13 skyscrapers, 4 levels of layered transit (subway-level, street-level, pedestrian skywalk, monorail).
-
River City 21 (Tsukishima)Most towers completed in the period 1988-2000East Towers II, 43 stories, 2000Century Park Tower, 54 stories, 1995-1999
River City 21 Shinkawa, 35 stories, 1995Skylight Tower, 40 stories, 1993 - Ebisu Garden Place (opened in 1994)
- Umeda Sky Building (opened 1993)
- Osaka’s second monorail (Opened in 1990. Extensions opened in 1994 and 1997.)
- Healthy Active Town Kobe (built 1996-1998).
- JR Twin Towers in Nagoya (1994-1999)
- Oasis 21 bus terminal (opened 2002)
Part Two: Demographic Collapse of Anglo-American Urban Centers
New York City, Chicago, and London suffered collapsing populations in the 1970-1980 time period, all shrinking by more than 10% within 10 years.
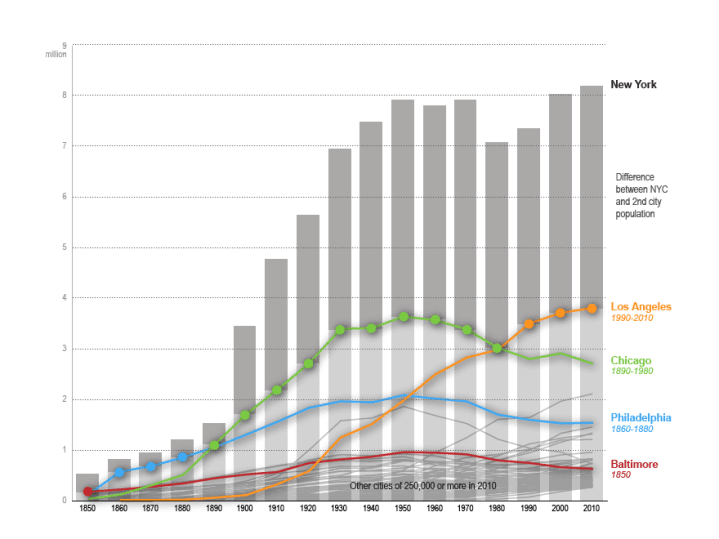
Source for NYC chart: census.gov

Source for Chicago chart: wikipedia
Interestingly, central Osaka also suffered 10%+ population loss in the 1970-1980 period.
Conclusion: The Lost Decade wasn’t Japan in the 90’s; it was The West* in the 70’s
*England and America (and also Osaka).
“Among the large cities in Japan, there are no counterparts of, for example, Liverpool or Detroit, which have seen sharp falls in population figures. The city of Osaka is perhaps the nearest counterpart.” ~Shrinkage in Japan, Yasuyuku Fujii

Very good article on Tokyo. Talking about demographic The most recent demographics for the city were released in the year 2010, and they show that 68.2% of its occupants are between the ages of 15-64. Befitting a country with one of the planet’s longest life expectancy, there is moreover a high degree of retired people in Tokyo: 20.4% of people were between 65 or above. Source : http://populationof2018.com/tokyo-population-2018.html
LikeLike