
Analysis of the area east of the Sannomiya Stations; Asahidori (旭通) and Kumoidori (雲井通).
This 0.14 square km (35 acres) area had a 2005 census population of about 2,500. This is an unusually high residential population density (~45,000/sqmi) for an area so close to the commercial center.
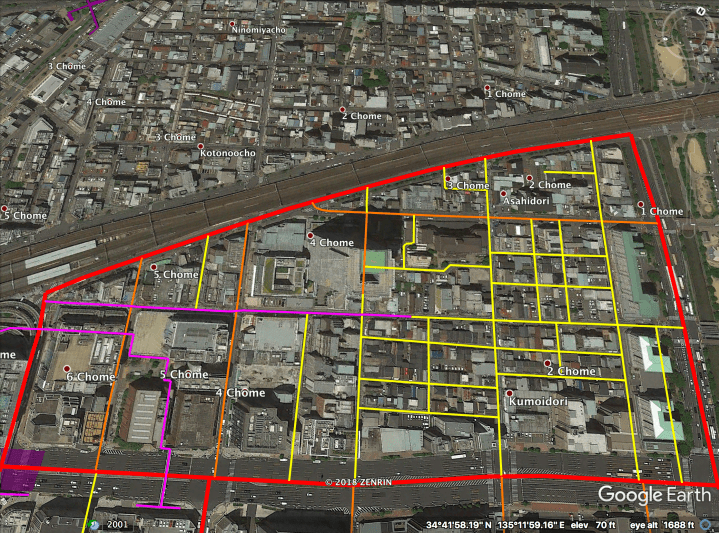 Streets are highlighted hierarchically as follows:
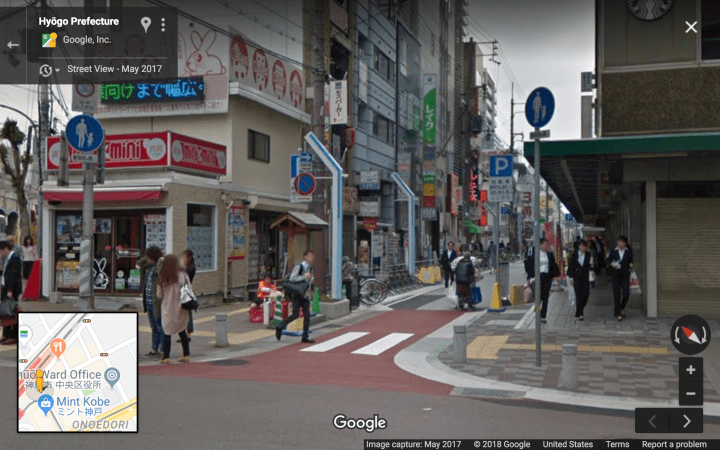
– Magenta (straight east-west): Open air shopping street (shotengai).
– Other Magenta: Station Direct Linked Deck Level.
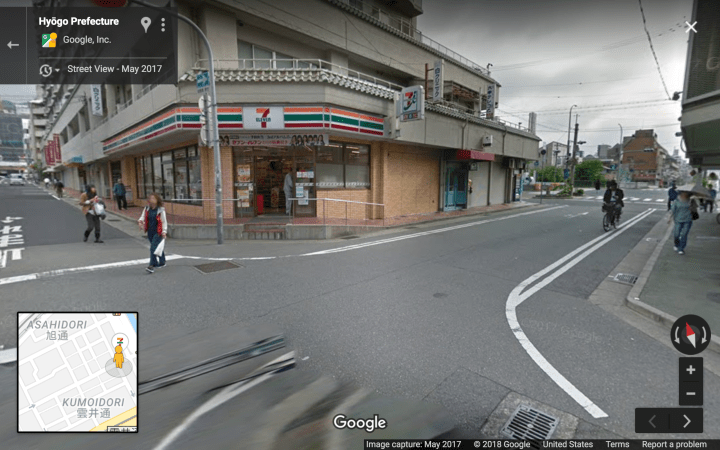
– Red: “Busy” Boulevards.
– Orange: “Quiet” Boulevards [in this area, most lack bollards].
– Yellow: Woonerfs & Narrow Streets.
Note that the whole highlighted area comprises less than a single island of walkability (the west end is comfortably connected to the Sannomiya Stations by both Deck Level and underground shopping (the “Santika” mall)).
The Hierarchy of Japanese Streets categorizes the highlighted streets as follows (with stats given for this area specifically):


Streets Hierarchy, Illustrated
Level 6A, Open air shopping street (shotengai):
Level 6C, Station direct linked Deck Level:

Level 4, “Busy” Boulevards:


Level 3, “Quiet” Boulevards:
[in contrast with the archetype, most “Quiet” Blvds here lack bollards]


Level 2, Woonerfs and Narrow Streets:


Wayfinding Map:

The “center” of the neighborhood; City Tower Plaza with Oasis supermarket and Daiso:


Very interesting, but could you clarify the point you are making? (Sorry, I’m a bit dense!)
Have you analyzed Hibiya and the new Hibiya Midtown, and Naka-Dori? It pains me to say it, but I think the developers did a remarkably good job overall. Compare to Tokyu Plaza which is just disgusting.
LikeLike
You are right to point out that this latest series of posts is largely devoid of theoretical content; I have been applying the “Hierarchy of Japanese Streets” to various neighborhoods, without commenting much on the results. This is “raw data” for future analysis.
I have two main goals:
A) Look for common patterns among the best (most pleasant & walkable) neighborhoods. I haven’t said so explicitly, but my expectation (hypothesis) is that the best neighborhoods will turn out to be those with a high density of shotengai, SLOW streets, woonerfs/narrow streets, and laneways (magenta, cyan, yellow, and green).
B) Fine-tune the “Hierarchy of Japanese Streets” system of classification. Assigning ranks to a variety of streets forces me to re-examine the definitions I’ve created, alternately reinforcing my confidence in the definitions, or causing me to re-evaluate their efficacy.
I will have to do some analyses of Tokyo Midtown Hibiya and Marunouchi Naka-dori. Definitely interesting places.
LikeLike